WalletHub wrote:1 Cincinnati, OH
2 Omaha, NE
3 Scottsdale, AZ
4 Tampa, FL
5 Boise, ID
6 Orlando, FL
7 Minneapolis, MN
8 St. Louis, MO
9 Reno, NV
10 Denver, CO
Methodology
To find the best and worst cities for recreation, WalletHub compared the 100 most populated U.S. cities across four key dimensions, including: 1) Entertainment & Recreational Facilities, 2) Costs, 3) Quality of Parks and 4) Climate. We then identified 27 relevant metrics, which are listed below with their corresponding weights. Please note that “city” refers to city proper and excludes surrounding metro areas.
Entertainment & Recreational Facilities – Total weight: 10
Number of Music Venues per 100,000 Residents: Full Weight
Number of Coffee & Tea Shops per 100,000 Residents: Full Weight
Number of Public Beaches per 100,000 Residents: Half Weight
Number of Tennis Courts per 100,000 Residents: Full Weight
Number of Public Golf Courses per 100,000 Residents: Full Weight
Number of Public Swimming Pools per 100,000 Residents: Full Weight
Number of Ball Diamonds per 100,000 Residents: Full Weight
Number of Basketball Hoops per 100,000 Residents: Full Weight
Number of Bike Rental Facilities per 100,000 Residents: Full Weight
Number of Attractions: Double Weight
Number of Food Festivals per 100,000 Residents: Full Weight
WalletHub “Sports Fans” Ranking: Full Weight
Note: Includes football, basketball, baseball and hockey.
Costs – Total weight: 10
Spending on Parks per Capita: Half Weight
Average Fitness Club Fee: Full Weight
Movie Costs: Full Weight
Bowling Costs: Full Weight
Grooming Costs: Full Weight
Average Beverage Price (Heineken’s, 6-pack, 12-oz. containers, excluding any deposit; 1.5-liter bottle, Chablis or Chenin Blanc or any white table wine): Full Weight
Average Food Price: Full Weight
Prevalence of Affordable 4.5+ Star Restaurants: Full Weight
Quality of Parks – Total weight: 5
Percentage of the Population with Walkable Park Access: Full Weight
Percent of Designed Parkland Areas: Full Weight
Presence on TripAdvisor’s “Top 25 Parks” List: Half Weight
Park Playgrounds per 100,000 Residents: Full Weight
Parkland as Percentage of City Area: Full Weight
Acres of Parkland per 100,000 Residents: Full Weight
Climate – Total weight: 2.5
WalletHub “Weather” Ranking
2015’s Best & Worst Cities for Recreation
Moderators: Coyote, nebugeater, Brad, Omaha Cowboy, BRoss
-
Coyote

- City Council
- Posts: 33295
- Joined: Tue Nov 18, 2003 11:18 am
- Location: Aksarben Village
- Contact:
2015’s Best & Worst Cities for Recreation
2015’s Best & Worst Cities for Recreation
Re: 2015’s Best & Worst Cities for Recreation
Wow, they ranked Omaha first in the 'quality of parks' portion as well.
-
nativeomahan

- County Board
- Posts: 5367
- Joined: Fri Nov 12, 2004 2:46 pm
- Location: Omaha and Puerto Vallarta
Re: 2015’s Best & Worst Cities for Recreation
I always take these surveys with a large grain of salt, regardless of whether their findings insult or flatter. For one thing, Omaha's climate rating is 75 (out of 100), right between San Antonio and Irving, Texas (metro Dallas). Whereas Lincoln has a Climate rating of 46 (out of 100) comparable to Honolulu and Chesapeke, VA. NYC's climate rating is 55, whereas Newark's is 90. Makes absolutely no sense.
And why isn't Des Moines even considered in this survey?
And why isn't Des Moines even considered in this survey?
-
skinzfan23

- City Council
- Posts: 9257
- Joined: Mon Feb 09, 2004 11:26 am
- Location: Omaha/Bellevue
Re: 2015’s Best & Worst Cities for Recreation
My guess is that Des Moines isn't over 225,000 for population.

Re: 2015’s Best & Worst Cities for Recreation
According to Wikipedia, the 2014 estimate was 209,220 (105th). Lincoln had 272,996 (72nd).skinzfan23 wrote:My guess is that Des Moines isn't over 225,000 for population.
Most of these things only consider the top 100 cities. I'm actually surprised because I thought Des Moines proper was bigger than Lincoln. TIL that 2/3 of DSM's population is in the suburbs.
-
Coyote
- City Council
- Posts: 33295
- Joined: Tue Nov 18, 2003 11:18 am
- Location: Aksarben Village
- Contact:
Re: 2015’s Best & Worst Cities for Recreation
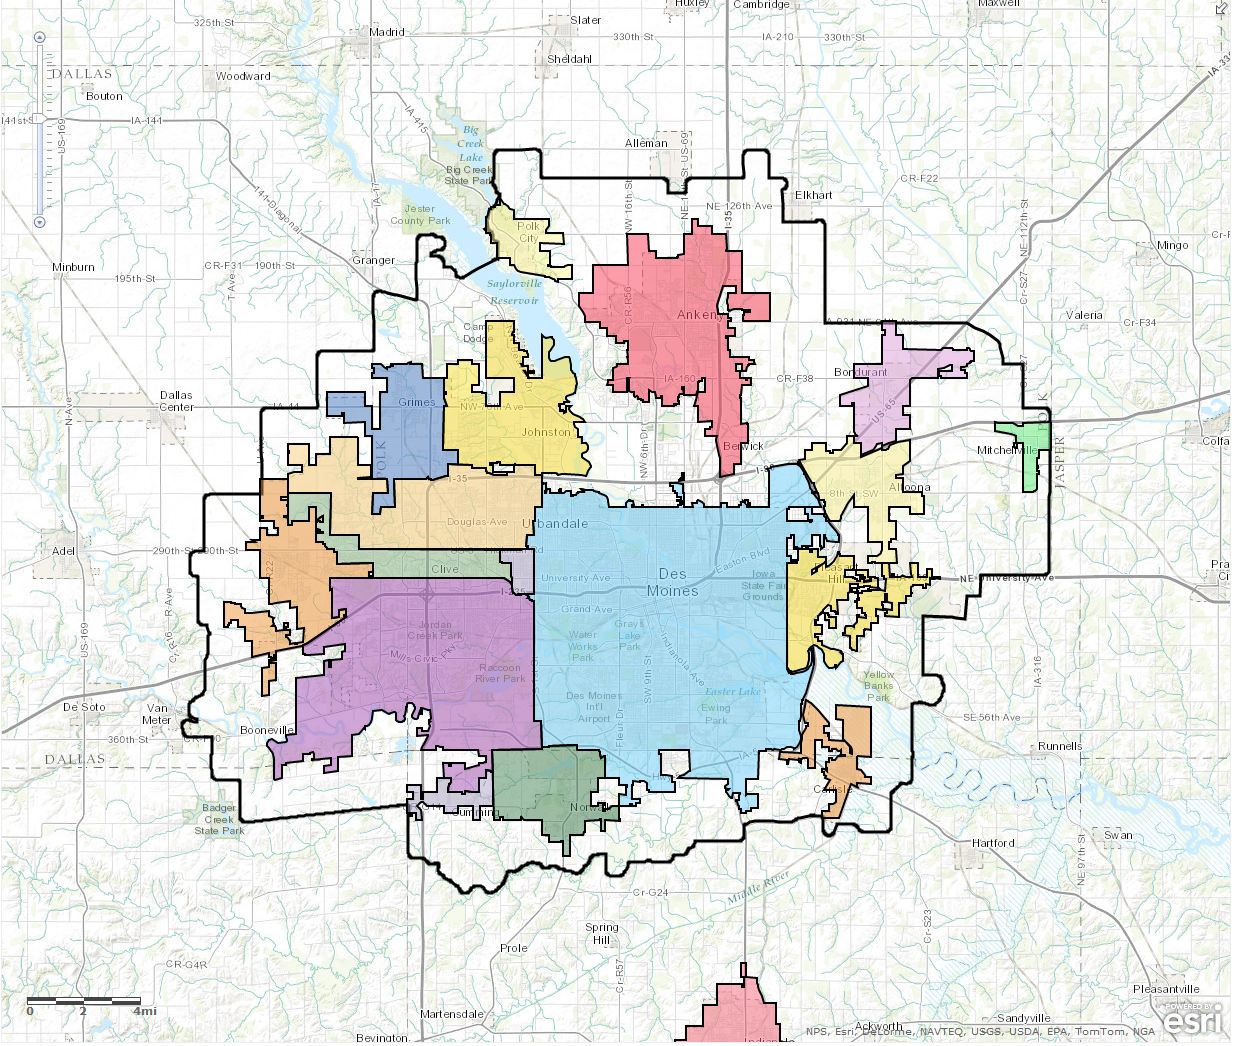
I tried to find an online map of DSM and it's suburbs...Urbandale, West DSM... but couldnt find one...
Re: 2015’s Best & Worst Cities for Recreation
These maps are sometimes hard to find. This map appeared to be the most recent, but the city labels are difficult to read. Hope this helps!Coyote wrote:I tried to find an online map of DSM and it's suburbs...Urbandale, West DSM... but couldnt find one...
Re: 2015’s Best & Worst Cities for Recreation
Thank you for calling that out. Now if only the OWH would print that! ;-)nativeomahan wrote:I always take these surveys with a large grain of salt, regardless of whether their findings insult or flatter. For one thing, Omaha's climate rating is 75 (out of 100), right between San Antonio and Irving, Texas (metro Dallas). Whereas Lincoln has a Climate rating of 46 (out of 100) comparable to Honolulu and Chesapeke, VA. NYC's climate rating is 55, whereas Newark's is 90. Makes absolutely no sense.
And why isn't Des Moines even considered in this survey?
-
skinzfan23
- City Council
- Posts: 9257
- Joined: Mon Feb 09, 2004 11:26 am
- Location: Omaha/Bellevue
Re: 2015’s Best & Worst Cities for Recreation
As of the 2014 estimates, Des Moines is finally larger than it has ever been. Granted the Des Moines metro is much larger than Lincoln's but Omaha and Lincoln (city proper) are growing much faster than Des Moines.
Re: 2015’s Best & Worst Cities for Recreation
Proper, but CSA wise DSM and to a lesser extent Lincoln are schooling Omaha at growth. And aren't the MSAs and CSAs more relevant when it comes to these lists.skinzfan23 wrote:As of the 2014 estimates, Des Moines is finally larger than it has ever been. Granted the Des Moines metro is much larger than Lincoln's but Omaha and Lincoln (city proper) are growing much faster than Des Moines.
15-17, 26, 32

Re: 2015’s Best & Worst Cities for Recreation
Here's another one with easier-to-read labels. It doesn't show the city of DesMoines proper as one color though.daveoma wrote:These maps are sometimes hard to find. This map appeared to be the most recent, but the city labels are difficult to read. Hope this helps!Coyote wrote:I tried to find an online map of DSM and it's suburbs...Urbandale, West DSM... but couldnt find one...
I've always thought Clive and Grimes were strange names for cities, and I never realized Clive was so skinny. 'We get down to the nitty-gritty in Grimes"

He said "They are some big, ugly red brick buildings"
...and then they were gone.
...and then they were gone.

Re: 2015’s Best & Worst Cities for Recreation
What those maps also don't quite show is that Iowan cities can annex across county lines.
OMA-->CHI-->NYC
Re: 2015’s Best & Worst Cities for Recreation
I wish Omaha could annex into surrounding counties. It's really kind of an arbitrary rule when you think about it. One way around it would be to have Sarpy and Douglas counties merge into one county. That will never happen though, with too many government entities fighting for their survival/identity.Garrett wrote:What those maps also don't quite show is that Iowan cities can annex across county lines.
They'd have to change the law that limits the size of annex-able communities to 10,000 population or less too.
It seems school districts determine where people want to live in a metro more than what city or county it is....and school districts can cross county lines.
He said "They are some big, ugly red brick buildings"
...and then they were gone.
...and then they were gone.