Omaha cracks the top 50 in GDP-

Omaha area Housing and Market statistics
User avatar
Omaha Cowboy
The Don
Posts: 1013726
Joined: Wed Jan 07, 2004 11:31 am
Location: West Omaha

Omaha cracks the top 50 in GDP-

Post by Omaha Cowboy »

Impressive GDP (Gross Domestic Product) growth for the Omaha metro. Omaha just passed Buffalo NY as the 50th largest GDP metro in the US.. A huge indicator of a heathly business and growth metro..Pretty cool info to share for my 13,000th post :) ..

Here is the top 100-

Rank
00998 United States (Metropolitan Portion) 23,080,903,727 --
35620 New York-Newark-Jersey City, NY-NJ-PA (Metropolitan Statistical Area) 2,163,208,840 1
31080 Los Angeles-Long Beach-Anaheim, CA (Metropolitan Statistical Area) 1,227,469,203 2
16980 Chicago-Naperville-Elgin, IL-IN-WI (Metropolitan Statistical Area) 832,899,746 3
41860 San Francisco-Oakland-Berkeley, CA (Metropolitan Statistical Area) 729,104,843 4
19100 Dallas-Fort Worth-Arlington, TX (Metropolitan Statistical Area) 688,928,266 5
47900 Washington-Arlington-Alexandria, DC-VA-MD-WV (Metropolitan Statistical Area) * 660,626,045 6
26420 Houston-The Woodlands-Sugar Land, TX (Metropolitan Statistical Area) 633,184,566 7
14460 Boston-Cambridge-Newton, MA-NH (Metropolitan Statistical Area) 571,666,671 8
12060 Atlanta-Sandy Springs-Alpharetta, GA (Metropolitan Statistical Area) 525,888,412 9
37980 Philadelphia-Camden-Wilmington, PA-NJ-DE-MD (Metropolitan Statistical Area) 518,485,094 10
42660 Seattle-Tacoma-Bellevue, WA (Metropolitan Statistical Area) 517,803,332 11
33100 Miami-Fort Lauderdale-Pompano Beach, FL (Metropolitan Statistical Area) 483,754,676 12
41940 San Jose-Sunnyvale-Santa Clara, CA (Metropolitan Statistical Area) 403,513,248 13
38060 Phoenix-Mesa-Chandler, AZ (Metropolitan Statistical Area) 362,086,516 14
33460 Minneapolis-St. Paul-Bloomington, MN-WI (Metropolitan Statistical Area) 323,972,835 15
19820 Detroit-Warren-Dearborn, MI (Metropolitan Statistical Area) 305,411,601 16
41740 San Diego-Chula Vista-Carlsbad, CA (Metropolitan Statistical Area) 295,644,871 17
19740 Denver-Aurora-Lakewood, CO (Metropolitan Statistical Area) * 288,800,471 18
12580 Baltimore-Columbia-Towson, MD (Metropolitan Statistical Area) 241,399,485 19
40140 Riverside-San Bernardino-Ontario, CA (Metropolitan Statistical Area) 237,912,621 20
16740 Charlotte-Concord-Gastonia, NC-SC (Metropolitan Statistical Area) 228,912,666 21
12420 Austin-Round Rock-Georgetown, TX (Metropolitan Statistical Area) 222,054,436 22
45300 Tampa-St. Petersburg-Clearwater, FL (Metropolitan Statistical Area) 219,413,810 23
41180 St. Louis, MO-IL (Metropolitan Statistical Area) 209,935,558 24
38900 Portland-Vancouver-Hillsboro, OR-WA (Metropolitan Statistical Area) 204,319,374 25
36740 Orlando-Kissimmee-Sanford, FL (Metropolitan Statistical Area) 194,472,288 26
34980 Nashville-Davidson--Murfreesboro--Franklin, TN (Metropolitan Statistical Area) 187,781,084 27
17140 Cincinnati, OH-KY-IN (Metropolitan Statistical Area) 186,141,091 28
26900 Indianapolis-Carmel-Anderson, IN (Metropolitan Statistical Area) 184,394,385 29
38300 Pittsburgh, PA (Metropolitan Statistical Area) 181,485,344 30
40900 Sacramento-Roseville-Folsom, CA (Metropolitan Statistical Area) 176,275,525 31
28140 Kansas City, MO-KS (Metropolitan Statistical Area) 169,501,437 32
18140 Columbus, OH (Metropolitan Statistical Area) 169,123,313 33
41700 San Antonio-New Braunfels, TX (Metropolitan Statistical Area) 163,060,744 34
17460 Cleveland-Elyria, OH (Metropolitan Statistical Area) 162,788,382 35
29820 Las Vegas-Henderson-Paradise, NV (Metropolitan Statistical Area) 160,727,901 36
41620 Salt Lake City, UT (Metropolitan Statistical Area) 135,409,299 37
33340 Milwaukee-Waukesha, WI (Metropolitan Statistical Area) 120,562,995 38
39580 Raleigh-Cary, NC (Metropolitan Statistical Area) 119,675,296 39
27260 Jacksonville, FL (Metropolitan Statistical Area) 117,162,018 40
47260 Virginia Beach-Norfolk-Newport News, VA-NC (Metropolitan Statistical Area) * 116,686,015 41
25540 Hartford-East Hartford-Middletown, CT (Metropolitan Statistical Area) 114,887,291 42
40060 Richmond, VA (Metropolitan Statistical Area) * 109,512,938 43
39300 Providence-Warwick, RI-MA (Metropolitan Statistical Area) 105,570,771 44
14860 Bridgeport-Stamford-Norwalk, CT (Metropolitan Statistical Area) 104,368,153 45
32820 Memphis, TN-MS-AR (Metropolitan Statistical Area) 96,182,860 46
36420 Oklahoma City, OK (Metropolitan Statistical Area) 94,741,711 47
35380 New Orleans-Metairie, LA (Metropolitan Statistical Area) 94,030,686 48
31140 Louisville/Jefferson County, KY-IN (Metropolitan Statistical Area) 90,835,739 49
36540 Omaha-Council Bluffs, NE-IA (Metropolitan Statistical Area) 85,021,025 50
15380 Buffalo-Cheektowaga, NY (Metropolitan Statistical Area) 84,673,053 51
10580 Albany-Schenectady-Troy, NY (Metropolitan Statistical Area) 80,302,855 52
13820 Birmingham-Hoover, AL (Metropolitan Statistical Area) 79,098,010 53
24340 Grand Rapids-Kentwood, MI (Metropolitan Statistical Area) 77,296,494 54
40380 Rochester, NY (Metropolitan Statistical Area) 75,085,365 55
46520 Urban Honolulu, HI (Metropolitan Statistical Area) 74,422,320 56
19780 Des Moines-West Des Moines, IA (Metropolitan Statistical Area) 67,333,798 57
20500 Durham-Chapel Hill, NC (Metropolitan Statistical Area) 63,949,634 58
12940 Baton Rouge, LA (Metropolitan Statistical Area) 62,951,412 59
37100 Oxnard-Thousand Oaks-Ventura, CA (Metropolitan Statistical Area) 62,328,544 60
46140 Tulsa, OK (Metropolitan Statistical Area) 61,966,173 61
35300 New Haven-Milford, CT (Metropolitan Statistical Area) 61,456,416 62
31540 Madison, WI (Metropolitan Statistical Area) 60,909,109 63
49340 Worcester, MA-CT (Metropolitan Statistical Area) 60,342,885 64
28940 Knoxville, TN (Metropolitan Statistical Area) 58,892,855 65
12540 Bakersfield, CA (Metropolitan Statistical Area) 57,540,870 66
24860 Greenville-Anderson, SC (Metropolitan Statistical Area) 57,403,426 67
16700 Charleston-North Charleston, SC (Metropolitan Statistical Area) 56,933,006 68
46060 Tucson, AZ (Metropolitan Statistical Area) 55,799,638 69
23420 Fresno, CA (Metropolitan Statistical Area) 55,426,932 70
33260 Midland, TX (Metropolitan Statistical Area) 55,015,425 71
10900 Allentown-Bethlehem-Easton, PA-NJ (Metropolitan Statistical Area) 54,322,843 72
17900 Columbia, SC (Metropolitan Statistical Area) 54,072,404 73
10740 Albuquerque, NM (Metropolitan Statistical Area) 53,861,763 74
19430 Dayton-Kettering, OH (Metropolitan Statistical Area) 53,329,306 75
14260 Boise City, ID (Metropolitan Statistical Area) 49,946,873 76
45940 Trenton-Princeton, NJ (Metropolitan Statistical Area) 49,620,483 77
35840 North Port-Sarasota-Bradenton, FL (Metropolitan Statistical Area) 49,368,638 78
45060 Syracuse, NY (Metropolitan Statistical Area) 49,280,551 79
24660 Greensboro-High Point, NC (Metropolitan Statistical Area) 49,028,583 80
17820 Colorado Springs, CO (Metropolitan Statistical Area) 47,904,871 81
25420 Harrisburg-Carlisle, PA (Metropolitan Statistical Area) 47,815,097 82
30780 Little Rock-North Little Rock-Conway, AR (Metropolitan Statistical Area) 47,322,282 83
45780 Toledo, OH (Metropolitan Statistical Area) 45,846,423 84
15980 Cape Coral-Fort Myers, FL (Metropolitan Statistical Area) 44,628,553 85
10420 Akron, OH (Metropolitan Statistical Area) 44,562,456 86
48620 Wichita, KS (Metropolitan Statistical Area) 43,935,159 87
38860 Portland-South Portland, ME (Metropolitan Statistical Area) 43,764,270 88
21340 El Paso, TX (Metropolitan Statistical Area) 43,283,173 89
39100 Poughkeepsie-Newburgh-Middletown, NY (Metropolitan Statistical Area) 42,861,273 90
49180 Winston-Salem, NC (Metropolitan Statistical Area) 40,939,454 91
39340 Provo-Orem, UT (Metropolitan Statistical Area) 40,760,880 92
44700 Stockton, CA (Metropolitan Statistical Area) 40,227,907 93
44140 Springfield, MA (Metropolitan Statistical Area) 40,110,493 94
39900 Reno, NV (Metropolitan Statistical Area) 40,094,964 95
16860 Chattanooga, TN-GA (Metropolitan Statistical Area) 40,041,675 96
36260 Ogden-Clearfield, UT (Metropolitan Statistical Area) 39,167,850 97
26620 Huntsville, AL (Metropolitan Statistical Area) 38,100,939 98
22220 Fayetteville-Springdale-Rogers, AR (Metropolitan Statistical Area) 37,748,740 99
29460 Lakeland-Winter Haven, FL (Metropolitan Statistical Area) 37,305,232 100

Check the rankings link here-

https://apps.bea.gov/itable/index.html? ... 1&nRange=5

Ciao..LiO…Peace

Go Cowboys!
User avatar
Coyote
City Council
Posts: 34365
Joined: Tue Nov 18, 2003 5:18 pm
Yahoo Messenger: jestcoyote
Location: Aksarben Village

Re: Omaha cracks the top 50 in GDP-

Post by Coyote »

Omaha Cowboy’s 13,000th posts! 🎉
Louie
County Board
Posts: 4960
Joined: Fri Dec 23, 2011 10:23 pm
Location: Dundee

Re: Omaha cracks the top 50 in GDP-

Post by Louie »

Coyote wrote: Sat Dec 09, 2023 8:42 pm Omaha Cowboy’s 13,000th posts! 🎉
Empirical evidence tying cowboy’s posting history to omaha’s economy. You saw it here first, folks!
User avatar
skinzfan23
City Council
Posts: 11661
Joined: Mon Feb 09, 2004 5:26 pm
Location: Omaha/Bellevue

Re: Omaha cracks the top 50 in GDP-

Post by skinzfan23 »

That is some good company to be in, both the GDP and 13,000th post.
almighty_tuna
City Council
Posts: 106406
Joined: Tue Apr 13, 2004 6:34 pm
Location: Somewhere between downtown and Colorado

Re: Omaha cracks the top 50 in GDP-

Post by almighty_tuna »

That's some objective data I can get behind. Well done for our MSA and The Don!
User avatar
Omaha Cowboy
The Don
Posts: 1013726
Joined: Wed Jan 07, 2004 11:31 am
Location: West Omaha

Re: Omaha cracks the top 50 in GDP-

Post by Omaha Cowboy »

Thank you all very much..

This latest GDP data (for 2022) is a very telling indicator of metro Omaha’s economic and growth health..

Omaha is definitely a metropolitan area coming into its own now. Our best days are ahead of us.. And it’s exciting to see…

Ciao..LiO…Peace
Go Cowboys!
User avatar
nativeomahan
County Board
Posts: 6020
Joined: Fri Nov 12, 2004 8:46 pm
Location: Omaha and Puerto Vallarta

Re: Omaha cracks the top 50 in GDP-

Post by nativeomahan »

Thank you for sharing. It’s a very interesting read (for statistic geeks like me, anyway). I note that Omaha is responsible for almost exactly half the GDP of Metro KC, despite metro KC being significantly more than twice the size of Omaha’s metro. I also noted with interest that metro Des Moines is hitting above its expected mark, as it blows past Wichita (a metro of comparable size) and even exceeds the outputs of much larger metros (Tulsa, Tucson, Albuquerque).
Metro NYC and both southern and central California (LA/Riverside/San Diego/San Jose/San Francisco-Oakland) are the sources of a tremendous percentage of the nation’s total GDP. Actually 15 of the top 25 metros are located either on a coast or within about 100 miles of one.
legato9
Home Owners Association
Posts: 166
Joined: Wed May 02, 2018 6:25 pm

Re: Omaha cracks the top 50 in GDP-

Post by legato9 »

nativeomahan wrote: Thu Dec 14, 2023 7:12 pm Thank you for sharing. It’s a very interesting read (for statistic geeks like me, anyway). I note that Omaha is responsible for almost exactly half the GDP of Metro KC, despite metro KC being significantly more than twice the size of Omaha’s metro. I also noted with interest that metro Des Moines is hitting above its expected mark, as it blows past Wichita (a metro of comparable size) and even exceeds the outputs of much larger metros (Tulsa, Tucson, Albuquerque).
Metro NYC and both southern and central California (LA/Riverside/San Diego/San Jose/San Francisco-Oakland) are the sources of a tremendous percentage of the nation’s total GDP. Actually 15 of the top 25 metros are located either on a coast or within about 100 miles of one.
I'm not wild about NYC or LA or San Francisco for a variety of reasons. That said, the most innovative, hard-working, creative, and productive people on the planet are there. Some people lose sight of that for political reasons, but New Yorkers and Californians are the engines of the world.
Athomsfere
Planning Board
Posts: 2300
Joined: Tue Sep 15, 2015 3:03 am

Re: Omaha cracks the top 50 in GDP-

Post by Athomsfere »

nativeomahan wrote: Thu Dec 14, 2023 7:12 pm Thank you for sharing. It’s a very interesting read (for statistic geeks like me, anyway). I note that Omaha is responsible for almost exactly half the GDP of Metro KC, despite metro KC being significantly more than twice the size of Omaha’s metro. I also noted with interest that metro Des Moines is hitting above its expected mark, as it blows past Wichita (a metro of comparable size) and even exceeds the outputs of much larger metros (Tulsa, Tucson, Albuquerque).
Some more fun on these notes:

Omaha has a higher GDP per capita by a bit. If you used that for the metros, Omaha would need about 1.95 million in the metro to equal KC's GDP, or about 88% of the KC metros current population.

Not bad.

DSM is about 112% the size of Wichita, but has close to 140% the GDP/C. So those two aren't even close in their ROC (Return on Capita, made up term).

I am not 100% sure on the BEA's accuracy though, as Honolulu's is below KC. Although, HNL I suppose is 99% tourism, I would expect it to be much higher.

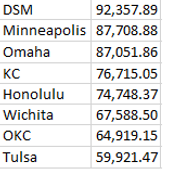
Finally: A small table of our regional "peers" with their GDP per capita, DSM kills it.

Image
Image

For text:
DSM 92,357.89
Minneapolis 87,708.88
Omaha 87,051.86
KC 76,715.05
Honolulu 74,748.37
Wichita 67,588.50
OKC 64,919.15
Tulsa 59,921.47
Louie
County Board
Posts: 4960
Joined: Fri Dec 23, 2011 10:23 pm
Location: Dundee

Re: Omaha cracks the top 50 in GDP-

Post by Louie »

Where is DSM getting the boost from?
User avatar
Omaha Cowboy
The Don
Posts: 1013726
Joined: Wed Jan 07, 2004 11:31 am
Location: West Omaha

Re: Omaha cracks the top 50 in GDP-

Post by Omaha Cowboy »

Speaking of killing it-

Another GDP tidbit- Douglas County (which of course, contains Omaha) was #1 in the nation for GDP growth for large US counties with a population 500,000 or larger over the last year at 9.2%!.. That is incredibly impressive..

Yet another sign of excellent business and growth health for metropolitan Omaha :thumb: …

Ciao..LiO…Peace
Go Cowboys!
Athomsfere
Planning Board
Posts: 2300
Joined: Tue Sep 15, 2015 3:03 am

Re: Omaha cracks the top 50 in GDP-

Post by Athomsfere »

Louie wrote: Mon Dec 18, 2023 4:17 pm Where is DSM getting the boost from?
My guess would be a mix of a) A very mature financial sector b) a slow but important growth in tech.

I think Omaha has the much better tech scene, and while our economy is fairly diverse we don't really have a second area of that strength that I can think of...
Athomsfere
Planning Board
Posts: 2300
Joined: Tue Sep 15, 2015 3:03 am

Re: Omaha cracks the top 50 in GDP-

Post by Athomsfere »

Omaha Cowboy wrote: Mon Dec 18, 2023 4:23 pm Speaking of killing it-

Another GDP tidbit- Douglas County (which of course, contains Omaha) was #1 in the nation for GDP growth for large US counties with a population 500,000 or larger over the last year at 9.2%!.. That is incredibly impressive..

Yet another sign of excellent business and growth health for metropolitan Omaha :thumb: …

Ciao..LiO…Peace
That is awesome, but also potentially worrisome for any households making under IDK, $200k...
User avatar
Garrett
County Board
Posts: 4736
Joined: Thu Nov 27, 2008 12:29 am
Location: New York City

Re: Omaha cracks the top 50 in GDP-

Post by Garrett »

Athomsfere wrote: Mon Dec 18, 2023 5:04 pm
Louie wrote: Mon Dec 18, 2023 4:17 pm Where is DSM getting the boost from?
My guess would be a mix of a) A very mature financial sector b) a slow but important growth in tech.

I think Omaha has the much better tech scene, and while our economy is fairly diverse we don't really have a second area of that strength that I can think of...
Don’t forget government jobs.

I’d say Omaha’s strengths lie in Insurance, Education, and Healthcare as well.
OMA-->CHI-->NYC
Athomsfere
Planning Board
Posts: 2300
Joined: Tue Sep 15, 2015 3:03 am

Re: Omaha cracks the top 50 in GDP-

Post by Athomsfere »

Garrett wrote: Mon Dec 18, 2023 5:21 pm
Athomsfere wrote: Mon Dec 18, 2023 5:04 pm
Louie wrote: Mon Dec 18, 2023 4:17 pm Where is DSM getting the boost from?
My guess would be a mix of a) A very mature financial sector b) a slow but important growth in tech.

I think Omaha has the much better tech scene, and while our economy is fairly diverse we don't really have a second area of that strength that I can think of...
Don’t forget government jobs.

I’d say Omaha’s strengths lie in Insurance, Education, and Healthcare as well.
I forgot about the Healthcare. UNMC could very well change our demographics with even the scaled down NeXt or however it was stylized.
User avatar
Omaha Cowboy
The Don
Posts: 1013726
Joined: Wed Jan 07, 2004 11:31 am
Location: West Omaha

Re: Omaha cracks the top 50 in GDP-

Post by Omaha Cowboy »

Athomsfere wrote: Mon Dec 18, 2023 5:05 pm
Omaha Cowboy wrote: Mon Dec 18, 2023 4:23 pm Speaking of killing it-

Another GDP tidbit- Douglas County (which of course, contains Omaha) was #1 in the nation for GDP growth for large US counties with a population 500,000 or larger over the last year at 9.2%!.. That is incredibly impressive..

Yet another sign of excellent business and growth health for metropolitan Omaha :thumb: …

Ciao..LiO…Peace
That is awesome, but also potentially worrisome for any households making under IDK, $200k...
I don't see this as a worrisome sign at all..

The BEA indicated Omaha had a large rise of growth in the Insurance industry..which was the biggest reason for the nation leading 9.2% annual spike in GDP growth for Douglas County…

Ciao..LiO…Peace
Go Cowboys!
User avatar
Renovator2559
Human Relations
Posts: 964
Joined: Tue May 23, 2023 7:48 pm
Location: Midtown Omaha

Re: Omaha cracks the top 50 in GDP-

Post by Renovator2559 »

Athomsfere wrote: Mon Dec 18, 2023 3:09 pm Some more fun on these notes:

Omaha has a higher GDP per capita by a bit. If you used that for the metros, Omaha would need about 1.95 million in the metro to equal KC's GDP, or about 88% of the KC metros current population.

Not bad.

DSM is about 112% the size of Wichita, but has close to 140% the GDP/C. So those two aren't even close in their ROC (Return on Capita, made up term).

I am not 100% sure on the BEA's accuracy though, as Honolulu's is below KC. Although, HNL I suppose is 99% tourism, I would expect it to be much higher.

Finally: A small table of our regional "peers" with their GDP per capita, DSM kills it.

Image
Image

For text:
DSM 92,357.89
Minneapolis 87,708.88
Omaha 87,051.86
KC 76,715.05
Honolulu 74,748.37
Wichita 67,588.50
OKC 64,919.15
Tulsa 59,921.47
Can anyone explain as to why KC is much lower than Omaha?

As for GDP, this article details how GDP does not paint a full picture of how well a society is doing and in fact over spending could be a sign of wasted resources for the sake of high GDP. This was apparent during the bank crashes during the 2000s and the French determined that other metrics would need to take into account.

https://www.scientificamerican.com/arti ... t-matters/

Omaha's high GDP with combination of excellent metrics in being in the Top 10 lists for decades and ranking high; indicates an accurate picture of how well Omaha is doing, so GDPis a good reflection in this instance.

The other day in DC, I met a stranger that knows Omaha because of the College World Series, CWS sure helps people know where we are.

In the Hugo BOSS store in downtown DC, I met this employee, that has cousins living in Omaha for 30 years and he said that his cousins tell him, they love it there and would never leave. It makes me grateful to hear beautiful comments like this, in the other side of the country!
Last edited by Renovator2559 on Tue Jan 09, 2024 11:50 pm, edited 1 time in total.
Home sweet, home...Omaha!
Athomsfere
Planning Board
Posts: 2300
Joined: Tue Sep 15, 2015 3:03 am

Re: Omaha cracks the top 50 in GDP-

Post by Athomsfere »

Renovator2559 wrote: Sun Jan 07, 2024 4:42 pm
Athomsfere wrote: Mon Dec 18, 2023 3:09 pm Some more fun on these notes:

Omaha has a higher GDP per capita by a bit. If you used that for the metros, Omaha would need about 1.95 million in the metro to equal KC's GDP, or about 88% of the KC metros current population.

Not bad.

DSM is about 112% the size of Wichita, but has close to 140% the GDP/C. So those two aren't even close in their ROC (Return on Capita, made up term).

I am not 100% sure on the BEA's accuracy though, as Honolulu's is below KC. Although, HNL I suppose is 99% tourism, I would expect it to be much higher.

Finally: A small table of our regional "peers" with their GDP per capita, DSM kills it.

Image
Image

For text:
DSM 92,357.89
Minneapolis 87,708.88
Omaha 87,051.86
KC 76,715.05
Honolulu 74,748.37
Wichita 67,588.50
OKC 64,919.15
Tulsa 59,921.47
Can anyone explain as to why KC is much lower than Omaha?
I'd say there isn't a single explanation, and I'm mostly positing guesses but:

Omaha is more educated, more white, more male, and more asian. All demographics that tend to earn a little more.

Omaha has more fortune 1000 companies: 10 vs 7.

Lastly, we have a great philanthropist community here. The donations keep projects and jobs perpetually in the pipeline it seems.