Updated April 2024
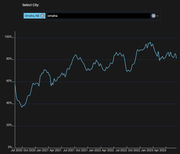
Data on cell phone activity (a.k.a. footfall) trends for the last year provide a picture of how downtowns are faring since our last rankings update in the summer of 2023. We look here at trends from March 1, 2023 through February 29, 2024. Trends are based on data from Spectus, but use different cell phone data providers from our rankings analysis. The trendlines measure the average level of activity over the course of the year, while the ranking metric shows the percent difference in the average number of stops in February 2024 relative to March 2023.
The dotted line provides a baseline of the average level of activity in March 2023, allowing for comparison to subsequent months. The solid line represents the average level of activity by week. When the solid line extends above the dotted baseline, downtown activity is greater compared to in March 2023. When it dips below the dotted line, activity is on a downswing. For most cities, there is an increase in month 6 or 7; this is expected since these are the summer months of June and July. The fall months see decreasing activity on average, with almost all downtowns losing activity by November. However, some cities stay above the March baseline, suggesting gradual recovery, while others dip well below it, i.e., stagnating recovery.
Key Findings
Overall, the median rate of change is 9.3% over the year, meaning that the median downtown in the U.S. and Canada’s largest metropolitan areas are gradually seeing more activity. Fifty downtowns are in an upward trajectory, while just 14 are trending downwards.
With a couple exceptions, the downtowns that are seeing the highest rates of activity increase, consistently higher relative to 2023, are the ones that were below 80% in our 2023 rankings. These cities seem to be trending towards recovery: Minneapolis, Montreal, Ottawa, Chicago, Louisville, Pittsburgh, Cincinnati, Boston, Washington DC, and Toronto. In other words, their recovery may now be converging with the downtowns that largely recovered in 2023.
On the other hand, for the 14 cities where recovery is faltering, we see three types of patterns. For a handful of cities that previously topped our rankings, such as Las Vegas, Colorado Springs, San Antonio, Fort Worth, Tampa, Wichita, Oklahoma City, activity rates are slowing (albeit slightly for most) and changing very little since March 2023. On the other hand, Dallas and San Francisco are both quite volatile, with significant new activity in summer 2023 decreasing below the baseline by fall and winter. A few downtowns, including Houston, Memphis, and Nashville, have basically stalled at the March 2023 activity rate.
To the extent possible, we will update this data on a monthly basis through 2024.
Visits to Downtown (March 1, 2023 to March 1, 2024)
1. Minneapolis 45.3%
2. Ottawa 38.0%
3. Montreal 36.4%
4. Chicago 35.5%
5. Louisville 32.5%
6. Pittsburgh 30.5%
7. Cincinnati 28.3%
8. San Jose 28.2%
9. Boston 27.3%
10. Washington DC 26.3%
11. Toronto 25.0%
12. Los Angeles 24.5%
13. Quebec 24.3%
14. Edmonton 23.2%
15. San Diego 21.4%
16. Oakland 20.6%
17. Detroit 20.2%
18. Raleigh 19.9%
19. Calgary 19.6%
20. New York 18.9%
21. Philadelphia 18.0%
22. Vancouver 17.3%
23. Winnipeg 16.7%
24. Honolulu 16.3%
25. Milwaukee 16.3%
26. St Louis 15.9%
27. Portland 14.1%
28. Denver 13.6%
29. Jacksonville 12.5%
30. Halifax 12.5%
31. Orlando 10.9%
32. Fresno 9.3%
33. Cleveland 9.2%
34. Sacramento 8.9%
35. Indianapolis 8.7%
36. Austin 7.9%
37. Albuquerque7.8%
38. Atlanta 7.4%
39. Bakersfield 7.4%
40. Seattle 7.0%
41. Kansas City 6.9%
42. Baltimore 6.5%
43. Tulsa 3.5%
44. Phoenix 3.5%
45. Columbus 3.2%
46. Omaha 3.0%
47. Salt Lake City 2.3%
48. Miami 0.5%
49. Tucson 0.4%
50. Charlotte 0.4%
51. Houston -0.5%
52. Memphis -1.0%
53. Nashville -2.6%
54. Wichita -2.9%
55. Oklahoma City -3.9%
56. Dallas -4.6%
57. London -4.9%
58. New Orleans -6.1%
59. Tampa -6.9%
60. Las Vegas -7.7%
61. Colorado Springs -8.1%
62. Fort Worth -9.4%
63. San Antonio -17.5%
64. San Francisco -21.6%
https://downtownrecovery.com/charts/trends












 …
…